Harami (Inside Day) Candlestick Pattern – Bullish Harami, Bearish Harami
What Is The Meaning Of Harami?
No, it is not the word used in Hindi language in this context. 😉 Harami means pregnant in Japanese. The candlestick pattern was named after it because of the way it looks. In English it is called as an Inside Day candlestick.
Formation Of The Harami Candlestick Pattern
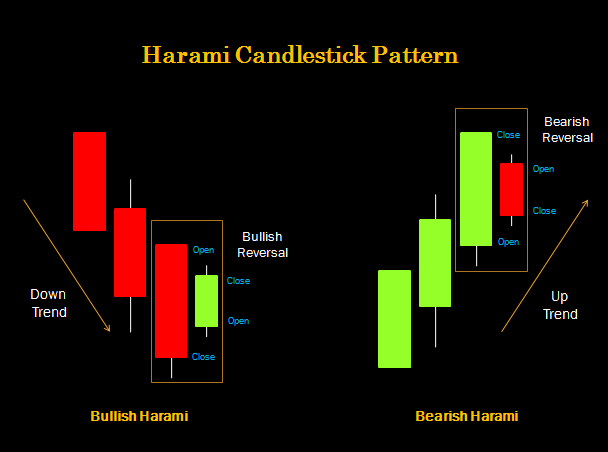
It is formed by the combination of two candlesticks, one containing the other. First candle with long real body is compared to ‘mother’ and second candle with small real body is compared to ‘baby’ in the womb. Hence the name of the candlestick pattern! The second candle is generally opposite in color to the first candle.
Future of the baby is unknown. It may climb up the life or it may keep falling down the life. In other words, this candlestick pattern on charts shows indecision in the market. It can appear anywhere on the chart, i.e. at the end of a bull run/up trend or at the end of a bearish/down trend or along the ongoing trend.
Psychology Behind The Harami Pattern
As the small real body of the second candle lies within the range of the long real body of the first candle, it shows indecision in the market. Also that the tug of war continued between bulls and bears through out the day but neither of them were really successful.
Types Of Harami Candlestick Patterns
There are two types of harami candlestick patterns – the bullish harami and the bearish harami.
Bullish Harami
The bullish harami pattern appears at the end of a down trend and signals a bullish trend reversal. The first candle is a long red/bearish candle making a new low as expected during bearish sentiment. But the next day, market opens at a price higher than the previous day’s close, creating a bit of panic among the bears. The price moves up due to short covering and fresh buying interest. However, at the high point of the day bears are again interested. At the end of the day, the price closes below the previous day’s opening price. Hence, the second candle is a green/bullish candle within the range (open – close) of the first candle.
The appearance of the green candle when least anticipated in the bearish trend, is expected to panic the bears and reverse the trend.
Bearish Harami
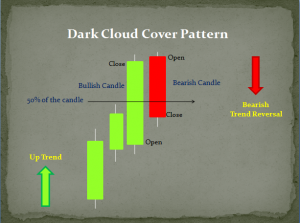
The bearish harami pattern appears at the top of an up trend and signals a bearish trend reversal. The first candle is a long green/bullish candle making a new high as expected during bullish sentiment. But the next day, market opens at a price lower than the previous day’s close, creating a bit of panic among the bulls. The price moves up down due to long unwinding and fresh selling interest. However, at the low point of the day bulls are again interested. At the end of the day, the price closes below the previous day’s closing price. Hence, the second candle is a red/bearish candle within the range (open – close) of the first candle.
The appearance of the red candle when least anticipated in the bullish trend, is expected to panic the bears and reverse the trend.
* Along the trend, it is a continuation pattern. Harami candlestick will keep appearing along the course of a trend, denoting a slow down before the price continues its journey as per the prior trend.
Significance Of Harami Pattern
If harami pattern is a part of NR4 (Narrow Range of 4 days) or NR7 (Narrow Range of 7 days), it will have more significance. It is a different trading strategy. The trading range for several days will be compressed like a spring and its breakout gives huge movement.
In any case Harami candlestick pattern should alert you to be cautious. You should be prepared to cover your long or short position, or to establish a new position. All these action depends on the following day’s confirmation candlestick.