Introduction to Technical Analysis
What is ‘Technical Analysis’?
Technical Analysis is one of the popular methods to estimate future price movement of stocks or indices, with the help of historical data – patterns and trends, and other technical indicators. It can also be applied to any other asset classes as long as the asset type has historical time series data. Time series data in technical analysis context is information pertaining to the price variables namely – open high, low, close, volume etc.
Though one cannot time the market to perfection (i.e. ideally buy when the price is at the lowest and sell at highest), technical analysis helps in taking better decisions. The core principle underlying technical analysis is that the market price reflects all available information that could impact a market. Hence, there’s no need to look at the fundamentals or any other studies, since they’re already priced into a given security.
Unlike fundamental analysts, technical analysts don’t care whether a stock is undervalued or overvalued. The only thing that matters is the stock’s past trading data and what information this data can provide about the future movement in the security.
Technical Analysis not only helps you develop a point of view on a particular stock or index but also helps you define the trade keeping in mind the entry, exit, holding time and risk perspective.
You may analyze historical charts, price, volume information, and use trends to figure out how the stock’s price may move in the future. Accordingly, buy stocks that you feel will appreciate and sell the ones you feel will depreciate.
History Repeats
Technical analysts believe that historical price trends tend to repeat over time.
This happens because the market participants consistently react to price movements in a remarkably similar way, each and every time the price moves in a certain direction. For example in up trending markets, market participants get greedy and want to buy irrespective of high price. Likewise in a down trend, market participants want to sell irrespective of the low and attractive prices. This human reaction ensures that the price history repeats itself.
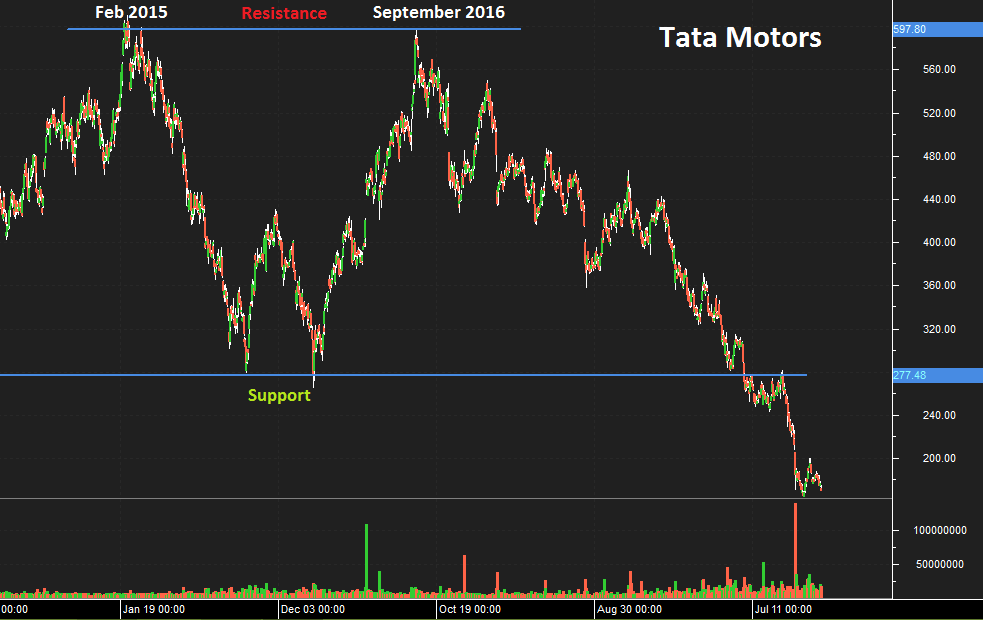
Example: Take a look at how the prices moved and the trends formed in the chart of Tata Motors. Well, history repeated right? There are many technical indicators, patters/trends and decisions making strategies using technical analysis which will be covered separately in detail.
Types of Technical Analysis
The two major types of technical analysis are chart patterns (behavioral) and technical indicators (statistical).
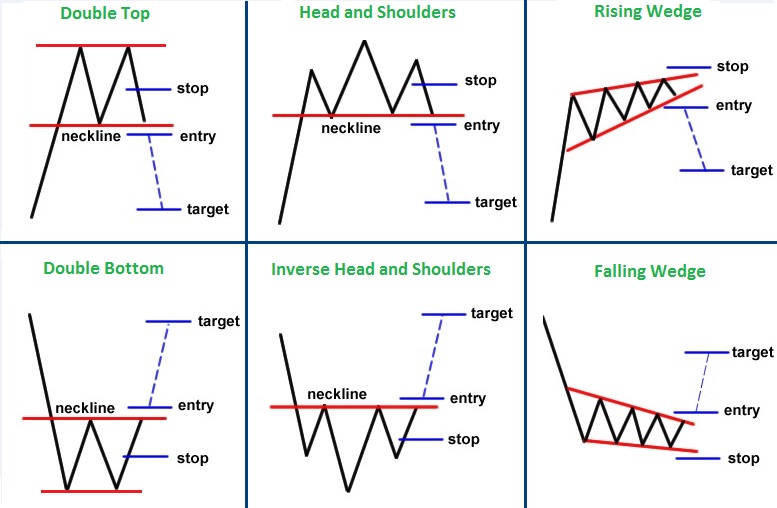
Chart patterns are behavioral or subjective form of technical analysis where the analyst will try to identify proven patterns on the chart formed due to the price action. These chart patterns help analyst in taking informed trades.
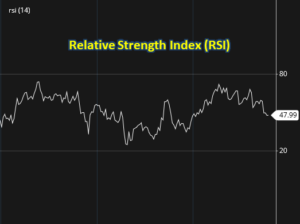
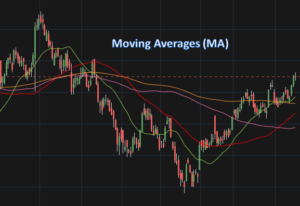
Technical indicators are a statistical form of technical analysis where analysts apply various mathematical formulas (indicators) to prices and volumes. Do not worry, as you don’t need to calculate them manually anymore, most of the trading platforms now allow you to apply the indicators with just a mouse click. All you need to do is to apply the indicators on the chart and estimate the future price movement of the security. While there are many technical indicators, MA (moving averages), MACD (moving average convergence-divergence) and RSI (Relative Strength Index) are commonly used.
History of Technical Analysis
The principles of technical analysis are derived from hundreds of years of financial market data. In the 17th century, some aspects of technical analysis began to appear in Amsterdam based merchant Joseph de la Vega‘s accounts of the Dutch financial markets. In Asia, Technical analysis is said to be a method developed by Homma Munehisa during the early 18th century which evolved into the use of candlestick techniques, and is today a technical analysis charting tool. Robert D. Edwards and John Magee bought these theories together and formalized them in 1948, by publishing the ‘Technical Analysis of Stock Trends‘ which is widely considered to be one of the seminal works of the discipline and remains in use to the present.