Paper Umbrella – Hammer – Hanging Man
How To Recognize A Paper Umbrella Candlestick?
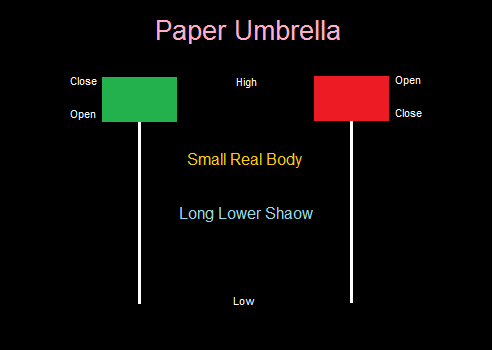
If the candlestick has a small upper body and long lower shadow as shown in the below image, it is a paper umbrella candlestick. To qualify a candle as a paper umbrella, the length of the lower shadow should be at least twice the length of the real body. This is called the ‘shadow to real body ratio’.
Role & Importance Of Paper Umbrella Candlestick
The paper umbrella is a single candlestick pattern which helps traders in setting up directional trades. The interpretation of paper umbrella changes based on where it appears on the chart.
Paper Umbrella Patterns – Hammer, Hanging Man
A paper umbrella signals two trend reversal patterns, hammer and hanging man. The color of either the hammer or the hanging man candle doesn’t matter, but where they appears and the ‘shadow to real body’ ratio do matter.
Hammer
If the paper umbrella appears at the bottom end of a downward rally, it is called ‘Hammer’ and it signals a bullish reversal in the trend. Longer the lower shadow more bullish is the pattern. The prior trend for the hammer should be a down trend. Though color of the candle does not really matter it is slightly more comforting to see a green/blue/white colored real body.
Psychology Behind The Hammer Formation
During a down trend, the market keeps falling making new lows. On the day the hammer pattern forms, the market as expected moves lower, and makes a new low. However at the low point, there is some amount of buying interest that emerges pushing the prices higher to the extent that the stock price closes near the high point of the day. This indicates that the bulls attempted to restrict the prices from falling further, and were reasonably successful. This action has the potential to change the sentiment in the stock, hence one should look to buy.
Hanging man
If the paper umbrella appears at the top end of an uptrend rally, it is called ‘Hanging man’ and it signals a bearish reversal in the trend. A hanging man signals a market high. The prior trend for the hanging man should be an uptrend.
Psychology Behind The Hanging Man Formation
This is exactly opposite to the hammer formation. During an up trend, the market keeps making new highs. On the day the hanging man pattern forms, from high point or opening price there is some amount of selling interest pushing the prices lower. The bulls attempt to push the price higher during the day but only manage to close near the opening price and forming a long lower shadow. This indicates that the bulls attempt reasonably failed. Thus, the hanging man makes a case for shorting the stock.
* Though by definition the paper umbrella should not have any upper shadow/wick, it is considered to be ok to have a negligible upper shadow.