The Spinning Top Candlestick
How Does A Spinning Top Candlestick Look Like?
A spinning top candlestick has a small real body along with an upper shadow and a lower shadow as shown in the figure below. The upper and lower shadows are almost equal height.
Small Real Body
The small size of the real body indicates that the open price and the close price for the specified time frame are close to each other. It can be represented with blue/green/white color indicating bullishness or red/black color indicating bearishness for the specified time frame.
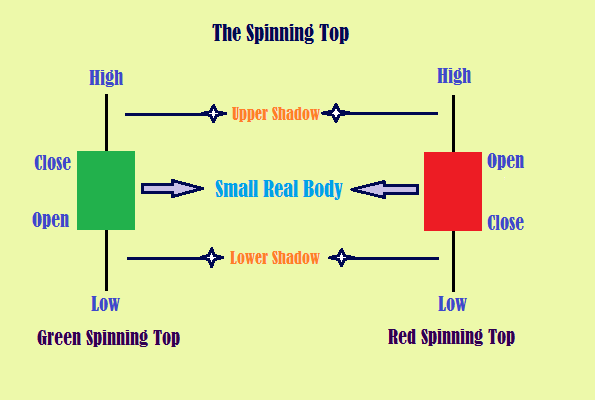
Upper Shadow
The upper shadow connects the real body to the high point during the specific time period (say for the day, week or month).
- If it is a green candle, the high and close are connected
- If it is a red candle, the high and open are connected
The upper shadow tells us that the bulls did attempt to take the market higher but could not hold the grip. If the bulls were successful, then the real body would have been a long green candle instead of a short candle.
Lower Shadow
The lower shadow connects the real body to the low point of the day.
- If it is a green candle, the low and open are connected
- If it is a red candle, the low and close are connected
On the other hand, the lower shadow tells us that the bears also made an attempt to take the market lower but were not successful either If the bears were successful, then the real body would have been a long red candle.
Let us consider the following example to understand the formation of a spinning top candlestick. Consider the OHLC of Reliance Industries(RIL) for the day as follows: open = 907, high = 917, low = 900, close = 910. Here the real body is just 3 points (difference between open and close) while upper and lower shadows are 7 points each. In this case it is a green candle as the share price of RIL closed higher than it’s opening price.
Unlike the Marubozu candlestick, spinning tops do not give a trading signal with specific entry and exit points.